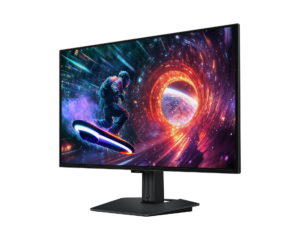
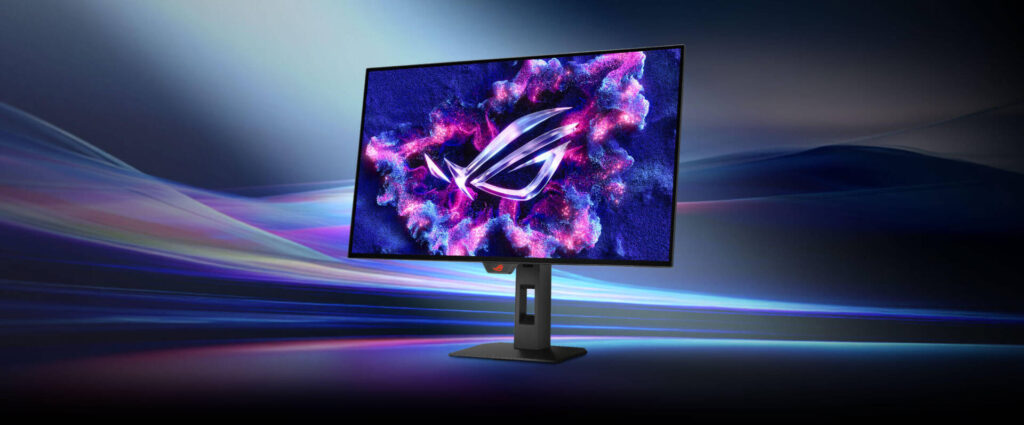
ASUS ROG Strix OLED XG27AQWMG: Specs, Features, Pros & Cons
Shop for a gaming OLED of this size and resolution today and the specification sheets blur together: the same contrast claim, the same response figure, the same certification badge, model after model. Two things still separate them, and this ASUS answers one of them emphatically.
The first is brightness. OLED's weakness has never been black level, it has been how much light the panel can throw at a highlight before its automatic limiter steps in, and the tandem panel used here exists specifically to address that. The practical effect is not a brighter desktop, because OLEDs stay conservative with full-screen white, but HDR content with real punch in its highlights.
The second is the coating, which decides where the monitor can live. A glossy OLED in a room with a window behind you spends its evenings showing you the window. In a room you can darken, it looks like nothing else on the shelf.
What ASUS did not spend on is the back panel. There is no video input for a laptop's single cable, so a laptop still needs its own dock, and no built-in input switch, so a second machine needs its own peripherals or a switch on the desk. That is a defensible choice for a display sold to desktop gamers and an irritating one for anyone whose work laptop shares the same desk during the day.
Everything else is what this category now takes for granted: a stand that adjusts properly, variable refresh that behaves with either graphics vendor, and a refresh ceiling high enough that your graphics card gives up first.
Read it as a room-dependent gaming panel with an unusually strong HDR ceiling, and look elsewhere for an all-purpose desk monitor. Where the room is dim and the source is a tower, very little at this size does better.
Category strengths
Where the ASUS ROG Strix OLED XG27AQWMG beats the median
- Much higher peak brightness ?1,500 nits vs 1,000 nits (median)
- A higher refresh rate ?280 Hz vs 240 Hz (median)
Where the ASUS ROG Strix OLED XG27AQWMG trails the median
- Fewer HDMI ports ?1 vs 2 (median)
How this VS Score was computed
Score 53: each known spec is measured against the median of OLED gaming monitors, 27 to 31 inches (16 products), then weighted; 50 means level with that median. In classes of six or more, a value beyond the class’s 10th–90th percentile range counts as that limit, so one extreme product cannot set the scale. 65% of the scoreable weight could be used; unknown values, features not applicable to this class and proxies (battery capacity where a rated life exists) add or remove nothing.
| Specification | This product | Cohort median | Score weight | Points moved |
|---|---|---|---|---|
| Peak brightness | 1,500 | 1,000 | 0.8 | +20.0 |
| HDMI ports | 1 | 2 | 0.4 | −10.0 |
| Headphone output | Yes | 75% of the class have it | 0.2 | +10.0 |
| Refresh rate | 280 | 240 | 1.2 | +9.6 |
| Screen size | 27 | 27 | 1.2 | +0.0 |
| Resolution | 1440p | 1440p | 1.2 | +0.0 |
| Panel type | OLED | OLED | 0.8 | +0.0 |
| Color depth | 10 | 10 | 0.3 | +0.0 |
| Response time | 0.03 | 0.03 | 0.8 | +0.0 |
| Contrast ratio | 1,500,000 | 1,500,000 | 0.6 | +0.0 |
| DCI-P3 coverage | 99.5 | 99 | 0.6 | +0.0 |
| HDR | True Black 400 | True Black 400 | 0.5 | +0.0 |
| Pixel density | 110 | 111 | 0.5 | +0.0 |
| Adaptive sync | G-Sync Compatible | G-Sync Compatible | 0.6 | +0.0 |
| DisplayPort inputs | 1 | 1 | 0.4 | +0.0 |
Not scored: Local dimming (not applicable: only 0% of this class have it); Local dimming zones (unknown: not scored); Variable refresh rate (standard for the class (100% have it)); Motion blur reduction (unknown: not scored); Input lag (unknown: not scored); Height adjustment (standard for the class (94% have it)); Tilt (standard for the class (100% have it)); Swivel (standard for the class (88% have it)); Pivot (standard for the class (81% have it)); USB-C (unknown: not scored); USB-C power delivery (unknown: not scored); USB hub (unknown: not scored); Built-in speakers (not applicable: only 0% of this class have it); KVM switch (unknown: not scored); Webcam (unknown: not scored); Microphone (unknown: not scored); Ethernet (unknown: not scored); Picture-by-picture (unknown: not scored).
Editor’s note
The XG27AQWMG uses a Tandem WOLED panel, and understanding that term is most of the buying decision.
Stacking two emissive layers instead of one lets the panel reach 1,500 nits, half again as bright as the QD-OLEDs around it, which top out near 1,000. On an OLED that brightness is the one thing that has historically been missing, so HDR here has force as well as contrast. Quoted contrast is 1,500,000:1, color coverage 99.5% DCI-P3, and response 0.03 ms.
Refresh is 280 Hz at 1440p, which is the combination competitive players actually want: high frame rates are achievable on mid-range hardware at this resolution in a way they are not at 4K. Pixel density is 110 ppi, the same as any 27-inch 1440p monitor, so this is a gaming panel first and a text panel second.
Note the connection panel before buying. There is one HDMI 2.1, one DisplayPort 1.4, no USB-C, no hub and no KVM, which makes it a monitor to plug a desktop into. The glossy coating gives the deepest-looking blacks and reflects a lit room accordingly.
Gigabyte's MO27Q28G uses the same panel and adds USB-C and a KVM, at the cost of a stand that only tilts. That is the real comparison.
Buy it for competitive gaming where brightness and motion clarity matter and a desktop is the only source. Buy the Gigabyte if a laptop shares the desk and you can live without swivel and pivot.
Specifications
Quality bars show where each figure sits between the lowest and highest of the 16 OLED gaming monitors, 27 to 31 inches this VS Score is measured against.
Picture
Gaming
Ergonomics & design
Connectivity
Features
Sources and verification
Where the specifications come from
- Official product pagerog.asus.com
- Independent testingrtings.com
Verification
- First published
- Specifications last checked
- Sheet completeness
- 29 of 42 specifications verified; the rest show as Unknown and are never estimated or scored
- Page type
- Product specification page — Compiled from the manufacturer’s published specifications and the cited sources; this is not a hands-on test.
- Basis
- Research-based: specifications and editorial text were compiled from the documents listed here and the manufacturer’s published data. We have not tested this unit ourselves; where independent measurements are mentioned they belong to the linked publication.
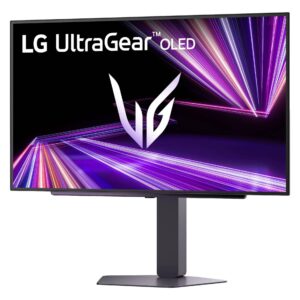
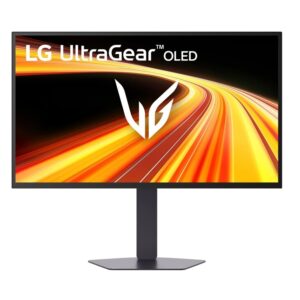
Monitors with similar specs to the ASUS ROG Strix OLED XG27AQWMG
Ratings & reviews
No reviews yet. Be the first to share your experience.
The bottom line
The ASUS ROG Strix OLED XG27AQWMG earns a VS Score of 53, above the median of the 16 OLED gaming monitors, 27 to 31 inches it is measured against (a score of 50 is level with that median).
- Who it’s for
- Dim-room gaming on a tower PC, for someone who wants the strongest HDR highlights at this size and a refresh rate a mid-range card can feed.
- Who should look elsewhere
- Look elsewhere if a work laptop shares the desk. With no single-cable laptop input, no hub and no input switch, it suits a single tower and little else.
- The trade-off that matters
- ASUS spent the money on the panel and left the back bare, which is fine for one PC and a nuisance the moment a second machine arrives.
- The main alternative
- Gigabyte MO27Q28G: the same panel with one-cable laptop docking and a built-in switch for two computers, for a desk shared by a laptop and a desktop, on a stand that only tilts.
The VS Score is calculated from the weighted specifications above, each measured against the median of comparable OLED gaming monitors, 27 to 31 inches — a shortlisting guide, not a substitute for your own priorities. See how we score.