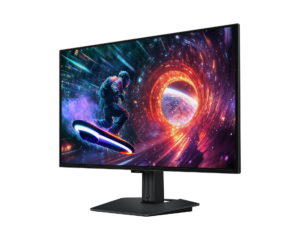
Dell Alienware AW2725Q: Specs, Features, Pros & Cons
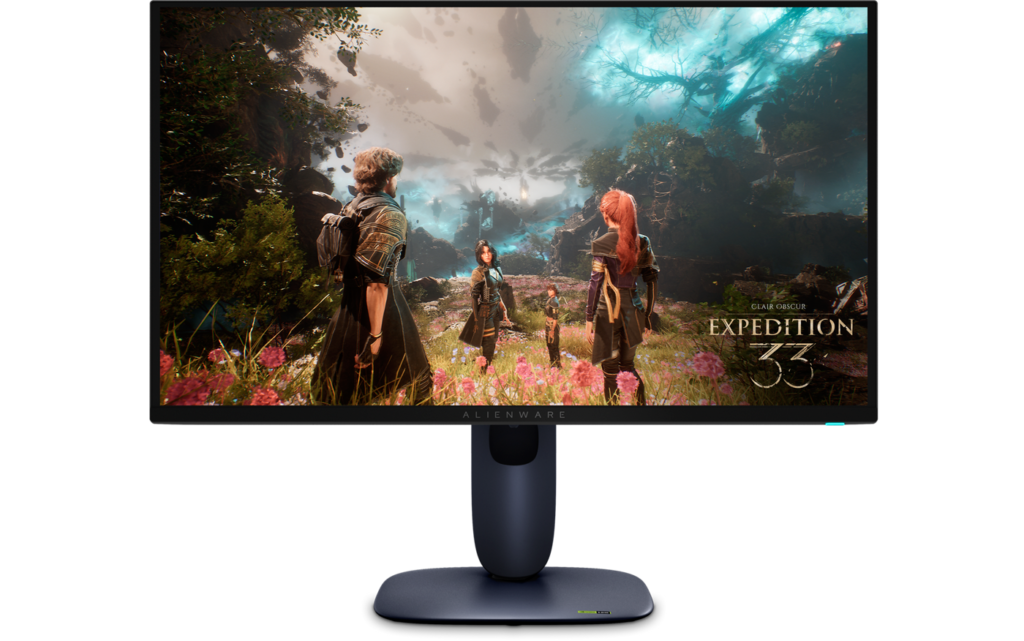
Alienware's AW2725Q belongs to a small group of monitors that put UHD resolution on a compact gaming screen with a self-emissive quantum-dot panel, and it is the entry in that group from the brand best known for gaming PCs. Its closest rivals from ASUS, MSI and others are built on the same generation of Samsung Display panel, so the image fundamentals are largely shared. What separates them is packaging: stand, connections, firmware and, above all, warranty terms.
That last point is Dell's strongest argument. Burn-in is the lingering worry with organic panels on a desktop, where taskbars, docked windows and game HUDs sit in the same place for hours. Dell's warranty for its Alienware OLED monitors explicitly includes burn-in, which turns the fear of permanent image retention into a service question rather than a gamble. Check the terms for your region, but it remains one of the clearer policies in the category.
Pixel density is the other defining trait. The screen is sharp enough to read documents and code comfortably, which makes it a plausible single display for someone who works and plays at the same desk. It need not be a gaming monitor tolerated through office hours. The high refresh rate asks a lot of the graphics card at native resolution, though, and many games will lean on upscaling to get there.
What it gives up is everything that would turn it into a workstation hub. Connections are built for a PC and consoles, with nothing to charge a laptop, and there is no audio path at all, so speakers or a headset have to hang off the computer. Brightness across a full white screen is modest too. For a dedicated gaming desk with a fast tower, that is a reasonable set of priorities. For a laptop-centered setup in a sunny room, it points to a different kind of monitor.
Category strengths
Where the Dell Alienware AW2725Q beats the median
- Has USB-C ?
- A much higher pixel density ?166 ppi vs 111 ppi (median)
Where the Dell Alienware AW2725Q trails the median
- No headphone output ?
- Much slower USB-C charging ?15 W vs 54 W (median)
How this VS Score was computed
Score 59: each known spec is measured against the median of OLED gaming monitors, 27 to 31 inches (16 products), then weighted; 50 means level with that median. In classes of six or more, a value beyond the class’s 10th–90th percentile range counts as that limit, so one extreme product cannot set the scale. 67% of the scoreable weight could be used; unknown values, features not applicable to this class and proxies (battery capacity where a rated life exists) add or remove nothing.
| Specification | This product | Cohort median | Score weight | Points moved |
|---|---|---|---|---|
| Resolution | 4K | 1440p | 1.2 | +60.0 |
| USB-C | Yes | 33% of the class have it | 0.5 | +25.0 |
| Pixel density | 166 | 111 | 0.5 | +12.5 |
| Headphone output | No | 75% of the class have it | 0.2 | −9.6 |
| USB hub | Yes | 73% of the class have it | 0.05 | +2.3 |
| USB-C power delivery | 15 | 54 | 0.05 | −1.6 |
| Screen size | 27 | 27 | 1.2 | +0.0 |
| Panel type | OLED | OLED | 0.8 | +0.0 |
| Refresh rate | 240 | 240 | 1.2 | +0.0 |
| Response time | 0.03 | 0.03 | 0.8 | +0.0 |
| Peak brightness | 1,000 | 1,000 | 0.8 | +0.0 |
| Contrast ratio | 1,500,000 | 1,500,000 | 0.6 | +0.0 |
| DCI-P3 coverage | 99 | 99 | 0.6 | +0.0 |
| HDR | True Black 400 | True Black 400 | 0.5 | +0.0 |
| Adaptive sync | G-Sync Compatible | G-Sync Compatible | 0.6 | +0.0 |
| HDMI ports | 2 | 2 | 0.4 | +0.0 |
| DisplayPort inputs | 1 | 1 | 0.4 | +0.0 |
Not scored: Color depth (unknown: not scored); Local dimming (unknown: not scored); Local dimming zones (unknown: not scored); Variable refresh rate (standard for the class (100% have it)); Motion blur reduction (unknown: not scored); Input lag (unknown: not scored); Height adjustment (standard for the class (94% have it)); Tilt (standard for the class (100% have it)); Swivel (standard for the class (88% have it)); Pivot (standard for the class (81% have it)); Built-in speakers (not applicable: only 0% of this class have it); KVM switch (unknown: not scored); Webcam (unknown: not scored); Microphone (unknown: not scored); Ethernet (not applicable: only 0% of this class have it); Picture-by-picture (unknown: not scored).
Editor’s note
The AW2725Q combines three things in one screen: 4K resolution, QD-OLED panel and a 240 Hz refresh rate in 27 inches. That combination gives 166 pixels per inch, which is dense enough that text looks clean without scaling gymnastics, which has historically been the weak point of OLED desktop monitors.
The panel does what QD-OLED does well. Response time is quoted at 0.03 ms, blacks are black, and color coverage reaches 99% DCI-P3 with DisplayHDR True Black 400 certification. In games, motion clarity is a visible step beyond any LCD.
Two practical points before buying. Full-screen brightness on QD-OLED is modest (250 cd/m2 typical, with 1000 reserved for small highlights), so a desk in direct sunlight is the wrong environment. And there are no speakers and no headphone output at all, so audio has to come from elsewhere entirely.
Connectivity is aimed at gaming: two HDMI 2.1 ports and DisplayPort 1.4, plus a USB-C carrying only 15 W, which is nowhere near enough to charge a laptop. The stand adjusts every way including pivot, and it takes a 100 x 100 VESA mount.
Buy it if you game on a PC at high frame rates and want desktop-grade sharpness for work in between. This is close to the ideal single-monitor setup for that pattern.
Look at an IPS panel if your desk is bright, if you display static interfaces for hours and worry about burn-in, or if you need a monitor that also charges a laptop over one cable.
Specifications
Quality bars show where each figure sits between the lowest and highest of the 16 OLED gaming monitors, 27 to 31 inches this VS Score is measured against.
Picture
Gaming
Ergonomics & design
Connectivity
Features
Sources and verification
Where the specifications come from
- Datasheet or manualdell.com
- Independent testingrtings.com
Verification
- First published
- Specifications last checked
- Sheet completeness
- 30 of 42 specifications verified; the rest show as Unknown and are never estimated or scored
- Page type
- Product specification page — Compiled from the manufacturer’s published specifications and the cited sources; this is not a hands-on test.
- Basis
- Research-based: specifications and editorial text were compiled from the documents listed here and the manufacturer’s published data. We have not tested this unit ourselves; where independent measurements are mentioned they belong to the linked publication.
Monitors with similar specs to the Dell Alienware AW2725Q

Ratings & reviews
No reviews yet. Be the first to share your experience.
The bottom line
The Dell Alienware AW2725Q earns a VS Score of 59, above the median of the 16 OLED gaming monitors, 27 to 31 inches it is measured against (a score of 50 is level with that median).
- Who it’s for
- A gaming desk built around a powerful desktop PC, where the same screen also handles reading and writing and the owner wants burn-in covered by the warranty.
- Who should look elsewhere
- Laptop-centered setups, sunny rooms, and anyone expecting sound from the monitor. Charging, full-screen brightness and audio all have to come from elsewhere.
- The trade-off that matters
- Class-leading sharpness and motion in one screen, in exchange for gaming-only connectivity and a heavy load on the graphics card.
- The main alternative
- ASUS ROG Swift OLED PG27UCDM: a close rival on the same panel type, with laptop charging over one cable if a single-cable desk matters.
The VS Score is calculated from the weighted specifications above, each measured against the median of comparable OLED gaming monitors, 27 to 31 inches — a shortlisting guide, not a substitute for your own priorities. See how we score.