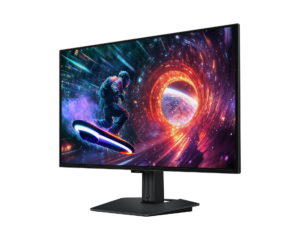
MSI MPG 321URX QD-OLED: Specs, Features, Pros & Cons
The large high-resolution gaming OLEDs of this generation are built on very similar panels, so choosing between them comes down to what each maker puts around the screen. MSI's answer here is to treat the monitor as the center of the desk.
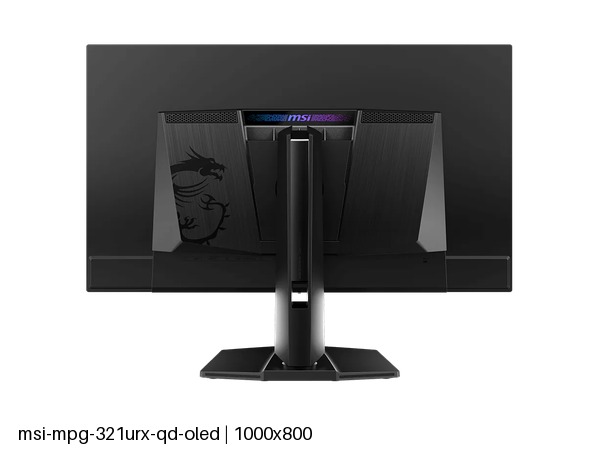
That shows on the back panel. A single cable can connect and charge a laptop, a hub takes the peripherals, a built-in switch moves one keyboard and mouse between two computers, and picture-by-picture puts both on screen at once. For someone with a work laptop and a gaming PC on the same desk, those features replace a dock and a switch box, which is where most of its real-world value lies. It sits in MSI's MPG line, the performance gaming tier below the flagship MEG models, and the stand follows the same practical thinking with a full range of adjustment.
There is a tension in that design worth recognizing. Features built for a working desk invite exactly the use this panel type tolerates least: hours of static windows, taskbars and toolbars. Text also renders a little less cleanly on QD-OLED than on a good IPS screen, although the high pixel density helps a great deal. None of that rules it out, but a buyer who expects to spend most of the day in documents should weigh it.
Where it fits best is a mixed desk that leans towards play: games and films in the evening, some laptop work during the day, and the wish for one screen and one cable to handle both. For a pure gaming setup with a single tower, the extras are money spent on ports that never get used.
Category strengths
Where the MSI MPG 321URX QD-OLED beats the median
- Has USB-C ?
- A higher pixel density ?140 ppi vs 111 ppi (median)
- Has picture-by-picture ?
- Much faster USB-C charging ?90 W vs 54 W (median)
- Has KVM switch ?
How this VS Score was computed
Score 59: each known spec is measured against the median of OLED gaming monitors, 27 to 31 inches (16 products), then weighted; 50 means level with that median. In classes of six or more, a value beyond the class’s 10th–90th percentile range counts as that limit, so one extreme product cannot set the scale. 72% of the scoreable weight could be used; unknown values, features not applicable to this class and proxies (battery capacity where a rated life exists) add or remove nothing.
| Specification | This product | Cohort median | Score weight | Points moved |
|---|---|---|---|---|
| Resolution | 4K | 1440p | 1.2 | +60.0 |
| USB-C | Yes | 33% of the class have it | 0.5 | +25.0 |
| Motion blur reduction | No | 22% of the class have it | 0.3 | −14.4 |
| Headphone output | Yes | 75% of the class have it | 0.2 | +10.0 |
| Picture-by-picture | Yes | 50% of the class have it | 0.2 | +10.0 |
| Pixel density | 140 | 111 | 0.5 | +6.5 |
| USB hub | Yes | 73% of the class have it | 0.05 | +2.3 |
| USB-C power delivery | 90 | 54 | 0.05 | +1.5 |
| KVM switch | Yes | 33% of the class have it | 0.02 | +1.0 |
| Screen size | 31.5 — capped at the class’s upper range (27) | 27 | 1.2 | +0.0 |
| Panel type | OLED | OLED | 0.8 | +0.0 |
| Color depth | 10 | 10 | 0.3 | +0.0 |
| Refresh rate | 240 | 240 | 1.2 | +0.0 |
| Response time | 0.03 | 0.03 | 0.8 | +0.0 |
| Peak brightness | 1,000 | 1,000 | 0.8 | +0.0 |
| Contrast ratio | 1,500,000 | 1,500,000 | 0.6 | +0.0 |
| DCI-P3 coverage | 99 | 99 | 0.6 | +0.0 |
| HDR | True Black 400 | True Black 400 | 0.5 | +0.0 |
| Adaptive sync | G-Sync Compatible | G-Sync Compatible | 0.6 | +0.0 |
| HDMI ports | 2 | 2 | 0.4 | +0.0 |
| DisplayPort inputs | 1 | 1 | 0.4 | +0.0 |
Not scored: Local dimming (not applicable: only 0% of this class have it); Local dimming zones (unknown: not scored); Variable refresh rate (standard for the class (100% have it)); Input lag (unknown: not scored); Height adjustment (standard for the class (94% have it)); Tilt (standard for the class (100% have it)); Swivel (standard for the class (88% have it)); Pivot (standard for the class (81% have it)); Built-in speakers (not applicable: only 0% of this class have it); Webcam (not applicable: only 0% of this class have it); Microphone (not applicable: only 0% of this class have it); Ethernet (not applicable: only 0% of this class have it).
Editor’s note
The MPG 321URX is the 4K QD-OLED to look at if you want the panel without paying the badge premium, and the specification is remarkably complete for what it costs.
The essentials match anything: 31.5 inches, 4K, 240 Hz, 0.03 ms, 99% DCI-P3, True Black 400 with 1,000 nits peak, and quoted contrast of 1,500,000:1. At 140 pixels per inch it is comfortable at a normal desk distance.
Where it beats its direct rivals is the desk furniture. There is USB-C with 90 W of laptop charging, a USB hub, a KVM switch and picture-by-picture, so one keyboard and mouse can drive a laptop and a desktop, with the laptop charging off the same cable. The stand does everything including pivot to portrait. Its closest competitor, Alienware's AW3225QF, has none of those.
One specification to read carefully: DisplayPort is version 1.4a rather than 2.1. 4K at the full refresh rate still works, using Display Stream Compression, which is visually lossless in practice but is the sort of thing worth knowing before you compare spec sheets.
The usual OLED terms apply: a semi-gloss coating that reflects more than matte, and static interface elements carrying a slow retention risk over years of desk use.
Buy it if you want a 4K high-refresh OLED that also does the job of a dock and a KVM. Buy the ASUS ROG Swift OLED PG32UCDM Gen3 if an uncompressed DisplayPort 2.1 link matters more than price, or the Alienware if you specifically want a curve.
Specifications
Quality bars show where each figure sits between the lowest and highest of the 16 OLED gaming monitors, 27 to 31 inches this VS Score is measured against.
Picture
Gaming
Ergonomics & design
Connectivity
Features
Sources and verification
Where the specifications come from
- Official product pagemsi.com
- Datasheet or manualstorage-asset.msi.com
Verification
- First published
- Specifications last checked
- Sheet completeness
- 38 of 42 specifications verified; the rest show as Unknown and are never estimated or scored
- Page type
- Product specification page — Compiled from the manufacturer’s published specifications and the cited sources; this is not a hands-on test.
- Basis
- Research-based: specifications and editorial text were compiled from the documents listed here and the manufacturer’s published data. We have not tested this unit ourselves; where independent measurements are mentioned they belong to the linked publication.
Monitors with similar specs to the MSI MPG 321URX QD-OLED
Ratings & reviews
No reviews yet. Be the first to share your experience.
The bottom line
The MSI MPG 321URX QD-OLED earns a VS Score of 59, above the median of the 16 OLED gaming monitors, 27 to 31 inches it is measured against (a score of 50 is level with that median).
- Who it’s for
- A gamer who also docks a work laptop at the same desk and wants one high-resolution, high-refresh OLED to replace a monitor, a dock and a switch box.
- Who should look elsewhere
- Anyone planning to leave static work layouts on screen all day, or who insists on the newest full-bandwidth video connection rather than a compressed one.
- The trade-off that matters
- Its desk extras make it the most practical OLED of its class for a mixed setup, yet mixed work means static windows, which is the one thing OLED handles worst.
- The main alternative
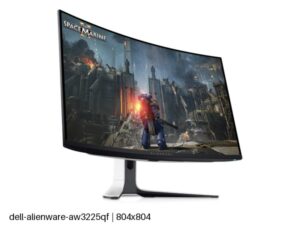
- Dell Alienware AW3225QF: the curved alternative built on the same kind of panel, for gamers who want immersion and have no use for a laptop cable or keyboard switching.
The VS Score is calculated from the weighted specifications above, each measured against the median of comparable OLED gaming monitors, 27 to 31 inches — a shortlisting guide, not a substitute for your own priorities. See how we score.